Table of Contents
View PAT Results (myPass)
The myPass View PAT Results screen accesses the PAT Results that have been made available to PASI, allowing users to view their results in myPass. This screen also provides a link such that users can create and download/print the ISP PDF version of the PAT results.
Security Requirements
See myPass Security Overview for the permissions needed to view student information.
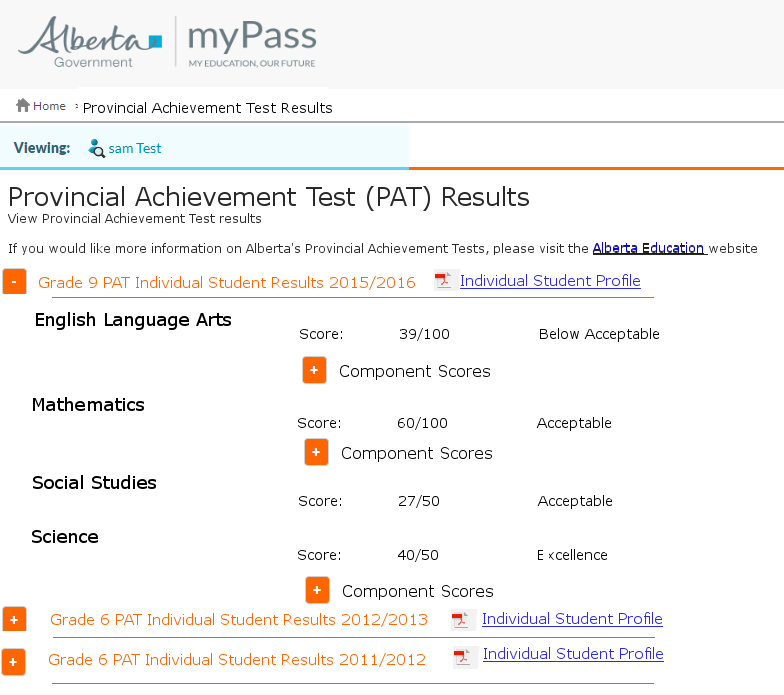
Large Resolution
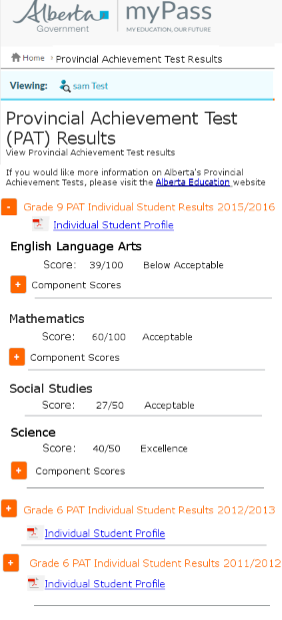
Small Resolution
Screen Details
The screen examples (both Large and Small) show the default view if the View PAT tile is clicked from the myPass Homepage and where PAT Result Status and/or the Component Result Status is “Regular”. See Non-Regular PAT Results for logic with respect to results that are not “Regular”.
- The Grid shows a list of a student’s PAT results grouped by School Year (latest first)
- There can be up to 5 PAT results for any School Year (the above examples show 4: English Language Arts, Mathematics, Social Studies, and Science).
- The link to the PDF will be created for each PAT/School Year combination. Note that the PDF itself is not created until the link is accessed (see PAT ISPs (PDF)).
- Only the most recent PAT is expanded on page load; the rest are collapsed by default
- For each PAT group, there are three columns (there are no column headers/titles).
- The first line and first column is the Course Name
- The second line and second column contains the Student’s Score
- The second line and third column contains the Standard Achieved (one of Below Acceptable, Acceptable, and Excellence)
- The third line:
- will exist only if Component results exist for this PAT Result (See social Studies in the screen examples above as an instance where Component results do not exist)
- is collapsed by default with the text “Component Scores”
- When opened, the expansion shows up to two Component Scores
- Component Name, Component Score, Standard Achieved
Data Fields
| Field Name | Description | |
|---|---|---|
| PAT Grade Group Expander Title | Grade {Grade} PAT Individual Student Results {School Year} | |
| {Grade} | Intended Grade Level | |
| {School Year} | Provincial Achievement Test School Year | |
| The rest of the rows in this table are repeated for up to 5 PAT results for this Grade Group – see the end of this section for their order | ||
| Line 1 Column 1 (Subject Column) | PAT Name | Course Full English Name |
| Line 2 Column 2 (PAT Score) | The word “Score:” followed by {#PATResult} / {#PATMax} | |
| {#PATResult} | the score on the PAT Result | |
| {#PATMax} | the max score for the PAT | |
| Line 2 Column 3 (Standard Achieved) | {StandardAchievedPAT} | “Excellence”, “Acceptable”, or “Below Acceptable” |
| “Excellence” | Displayed if the score on the PAT Result is equal to or greater than the Excellence Cut Score on the PAT | |
| “Acceptable” | Displayed if the score on the PAT Result is equal to or greater than the Acceptable Cut Score and less than the Excellence Cut Score on the PAT | |
| “Below Acceptable” | Displayed if the score on the PAT Result is less than the Acceptable Cut Score on the PAT. | |
| Line 3: Note that this line does not exist for all PAT tests as not all PAT tests have components | ||
| Line 3 Column 1 | The text “Component Scores”, initially collapsed when there are PAT Component Results | |
| When expanded | ||
| Line 3 Column 1 (Component Name) | Provincial Achievement Test Component English Label followed by a colon “:” | |
| Line 3 Column 2 (Component Scores) | {#Score} / {#MaxScore} where: | |
| {#Score} | is the score on the on the PAT Component Result Score | |
| {#MaxScore} | is the max score on the Provincial Achievement Test Component Max Score | |
| Line 3 Column 3 (Standard Achieved) | {StandardAchievedPATComponent} | “Excellence”, “Acceptable”, or “Below Acceptable” |
| “Excellence” | Displayed if the score on the PAT Component Result Score is equal to or greater than the Provincial Achievement Test Component Excellence Cut Score | |
| “Acceptable” | Displayed if the score on the PAT Component Result is equal to or greater than the Provincial Achievement Test Component Acceptable Cut Score and less than the Provincial Achievement Test Component Excellence Cut Score | |
| “Below Acceptable” | Displayed if the score on the PAT Component Result is less than the Acceptable Cut Score on the PAT Component | |
There are currently 5 PAT tests and are sorted on this screen in the following order:
- English Language Arts
- Mathematics
- Social Studies
- Science
- French Language Arts
Links
There are two links on these myPass PAT results screens
| Link Label | Link Description |
|---|---|
| Individual Student Profile | link to the ISP PDF functionality |
| The naming of the PDF that is generated will be formatted as {ASN}ISP{School Year}.pdf (the same as in PASIprep) | |
| * {ASN} – is the Alberta Student Number (aka: state province id) belonging to the Student that wrote the PAT exam. | |
| * {School Year} – is the School Year for the PAT Result(s) in the format “YYYY-YYYY” | |
| A request to use this service will include all of: | |
| * Alberta Student Number | |
| * School Year | |
| * Language – as selected by the myPass user, toggles between English and French | |
| Alberta Education Website | link to https://www.alberta.ca/provincial-achievement-tests.aspx |
Alternative Screens
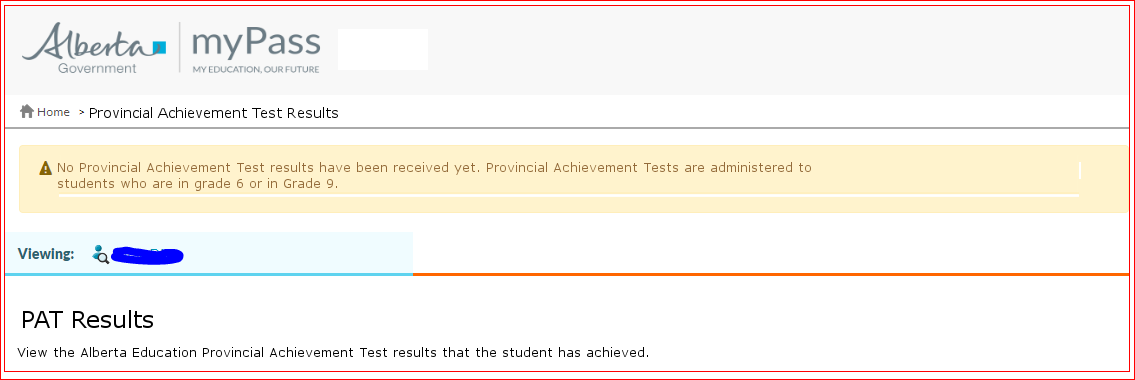
No PAT Results
If the student has no PAT results to display and if the PAT tile is clicked on the myPass Home Page, the master grid/detail will be replaced with the following screen
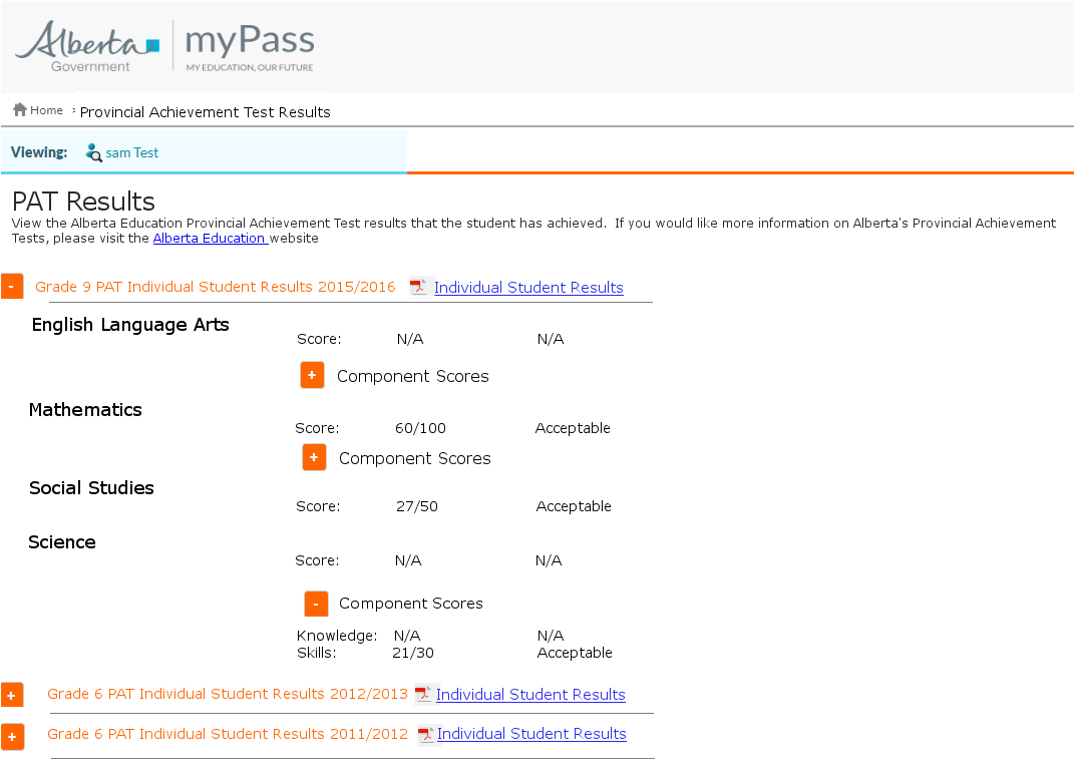
Non-Regular PAT Results
There are several PAT Result and PAT Component Result statuses that are not “Regular”. When any of these occur, they have the same affect on the screen display as can be seen in the example screen, below:
- If the PAT Result STATUS is not “Regular”, “N/A” will be displayed on line 2 column 2 (PAT Score ) and column 3 (Standard Achieved).
- If the Component Result Status is not “Regular”, “N/A” will be displayed on line 3 column 2 (PAT Component Score) and column 3 (Standard Achieved) after the component name.


