Table of Contents
PAT ISPs (PDF)
This functionality is available in both English and French. Please refer to French Translations page for the French text.
Overview
The Provincial Achievement Test (PAT) Individual Student Profile (ISP) is a two page document that details a student's PAT Result information for Provincial Achievement Test written in a given school year at a specific school. The ISP normally includes the results of the 4 or 5 tests, targeted to students in Grade 6 and Grade 9. The normal scenario is for students to write their PATs in Grade 6 and then again in Grade 9 and thus most student will have two sets of PAT results.
The PAT Results included in the ISP will be based on the PAT Results the organization has access to as per the PAT Results data access rules.
Each PAT ISP is a 2 page document per student, per school year, per school. If the requesting organization has access to PAT Results written in different schools within the same school year, requesting an ISP will include a 2 page ISP per school. Therefore, the PDF returned may be 2, 4, 6, 8 or 10 pages depending on the number of schools in which the student wrote their PATs.
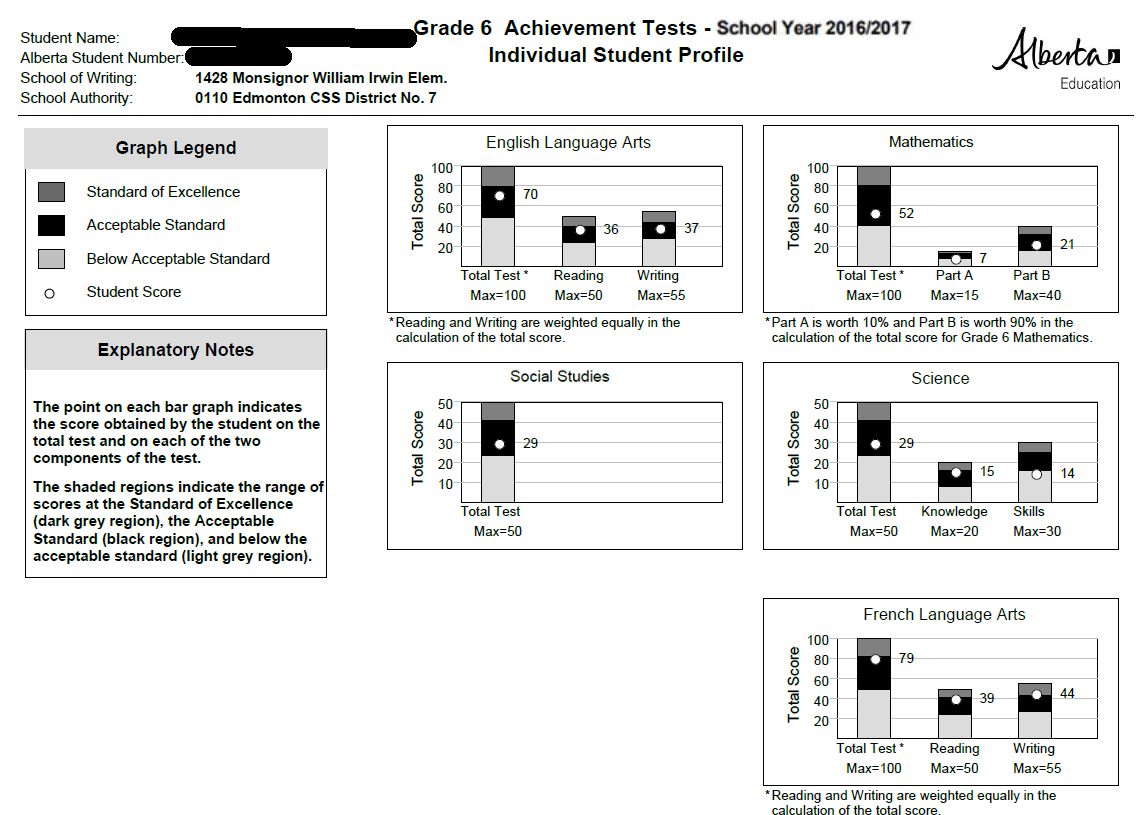
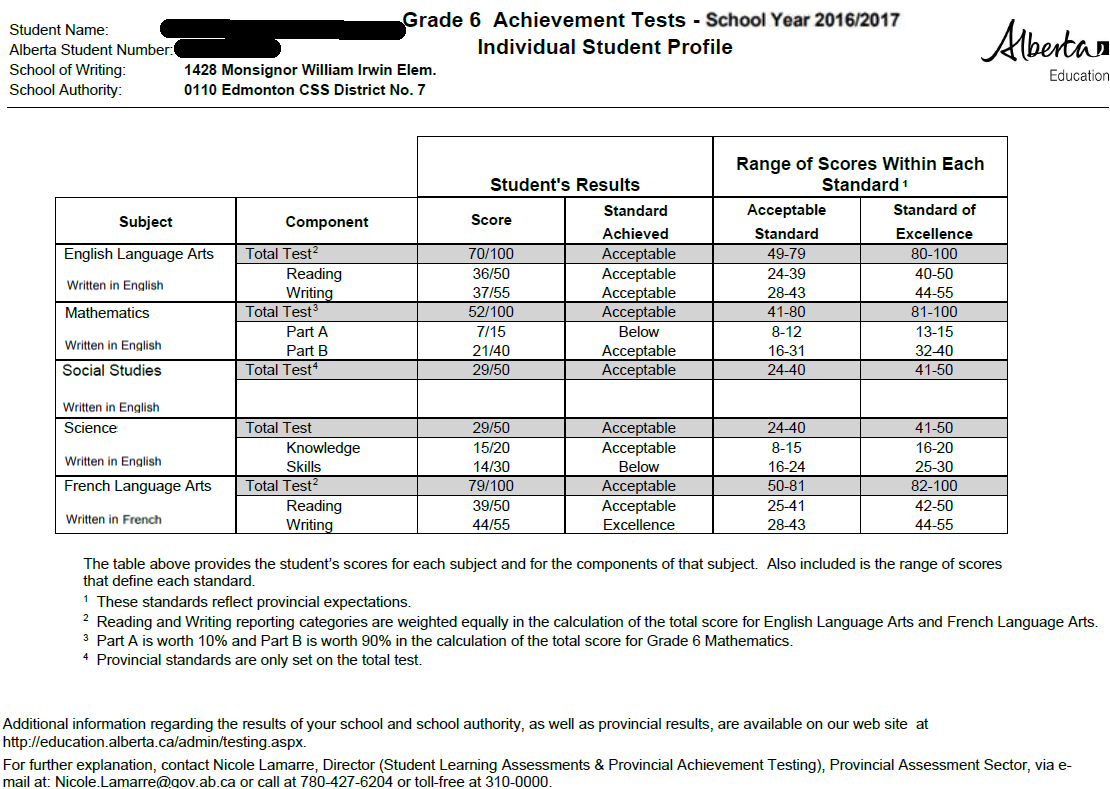
See first page full sample and second page full sample for overall context of this documentation.
Page Header
Data Elements
| Element | Source Data Set Element | Source Attribute |
|---|---|---|
| Left Justified | ||
| Student Name | Student's Preferred Name | Formatted Last name, First name Middle name, Suffix |
| Student Number | Alberta Student Number | Formatted as prescribed in the PASI Data Format Guidelines |
| School of Writing | PAT Result School Code | |
| School Authority | School Authority | the current authority name for the authority that is associated to the school code on the PAT Result |
| Centered | ||
| Grade | Intended Grade Level | Grade is the grade level of the Intended Grade on the Course record |
| Achievement Tests - | N/A | The text “Achievement Tests -” |
| School Year | Provincial Achievement Test School Year | School Year is the school year for the PAT in the format “YYYY/YYYY” |
| Individual Student Profile | N/A | On the second line, the text “Individual Student Profile” |
| Right Justified | ||
| {Logo} | N/A | The Alberta Government Logo at the right-hand side of the Page Header section. |
| Bottom | ||
| The Page Header is to be underlined at the bottom of all of its content | ||
PAT ISP Page 1
The first page of the PAT ISP contains the following sections:
- Legend
- Notes
- Accommodations
- Body
Legend
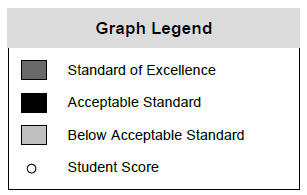
This section of the document is used to provide the legend descriptions for the colors and shapes displayed on the bar graphs in the document body. The Graph Legend section is left justified and located underneath the Page Header section.
Data Elements
| Element | Source Data Set Element | Source Attribute |
|---|---|---|
| Top Row (Title) | N/A | Label “ Graph Legend ” centered, highlighted in a light grey box (no border) |
| White square box outlined in black on the left, right, and bottom containing 4 lines: | ||
| Line 1 | N/A | Dark Grey square symbol, followed by 5 spaces, followed by a label reading “Standard of Excellence” |
| Line 2 | N/A | Black square symbol, followed by 5 spaces, followed by a label reading “Acceptable Standard” |
| Line 3 | N/A | Light Grey square symbol, followed by 5 spaces, followed by a label reading “Below Acceptable Standard” |
| Line 4 | N/A | Small white circle outlined in black, followed by 5 spaces, followed by a label reading “Student Score” |
Explanatory Notes
This section of the document is used to provide an explanation of how to read the bar graphs on the first page. The Explanatory Notes section is left justified, bolded, and located underneath the Graph Legend section.
Data Elements
| Element | Source Data Set Element | Source Attribute |
|---|---|---|
| Top Row (Title) | N/A | Label reading “ Explanatory Notes”, Bolded, Centered, highlighted in a light grey box (with a black boarder on the left, right, and top) |
| 1st Paragraph | N/A | “The point on each bar graph indicates the score obtained by the student on the total test and on each of the two components of the test”, Bolded, Left Justified |
| 2nd Paragraph | N/A | “The shaded regions indicate the range of scores at the Standard of Excellence (dark grey region), the Acceptable Standard (black region), and below the acceptable standard (light grey region).”, Bolded, Left Justified |
Accommodations
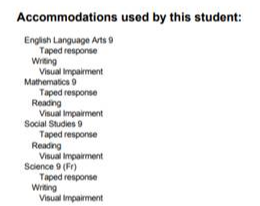 This section of the document is used to provide a description of the accommodations used for the PAT.
The Accommodations section is left justified, bolded and located underneath the Explanatory Notes section.
Data Elements
| Element | Source Data Set Element | Source Attribute |
|---|---|---|
| Top Row (Title) | N/A | Label reading “Accommodations used by this student:” |
| Bolded | ||
| Repeat Course and Accommodations for each PAT Result for this Grade level | ||
| Course | Provincial Achievement Test Course Code | The Course Name from the Course English Short Name of the PAT if the Provincial Achievement Test Language is “English” otherwise use the Course French Short Name |
| Accommodations | PAT Result Accommodations | If the PAT result has no components, otherwise |
| PAT Component Result Accommodations | when the PAT has components | |
Body
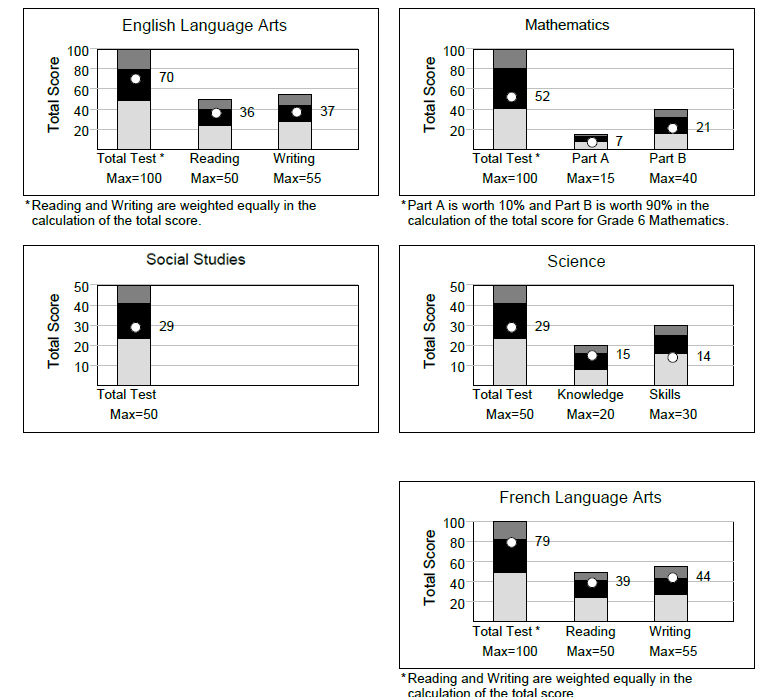
This section of the document will display the bar graph(s) applicable for the provincial achievement test results. Referring to the accompanying image, the Document Body will contain:
- 2 bar graphs on the left side (top, middle) and
- 3 bar graphs on the right side (top, middle, bottom).
The following graphs will be displayed in the following locations:
| Subject: Language Arts Language: English | Subject: Mathematics |
| Subject: Social Studies | Subject: Science |
| Subject: Language Arts Language: French |
The layout and order of the subjects never changes. If a PAT Result exists for the subject/course it is always displayed in the same location, courses without PAT Results display a blank space (not an empty graph).
The following data is included in the first page “Graphs” section of the report when the PAT Result Status or PAT Component Result Status is “Normal”:
Data Elements
| Element | Source Data Set Element | Source Attribute |
|---|---|---|
| PAT Result Frame | N/A | Each bar graph will be placed in white square box outlined in black |
| Bar Graph Frame | N/A | The bar graph will appear in a smaller white box outlined in black There are five rows in each of these frames, with each row with a black line at the top |
| Title | Course Name | in the language submitted in the request from the Get PAT Result ISP service. Centered at top of bar graph |
| Footnotes | Footnotes | If there are footnotes for the Course on the Provincial Achievement Test, display the footnote below the PAT Result Frame |
| Element | Source Data Set Element | Source Attribute |
|---|---|---|
| Bar Graph Labels | ||
| “Total Score” | N/A | The text “Total Score” |
| Scores | Each bar contains 5 rows | |
| Values | Max Score | Use the Max Score divided by 5 to determine numeric values to display on the left hand side of each of the 5 rows. For example if the Max Score is 100, display: 20 – to the left of row 1 40 – to the left of row 2 60 – to the left of row 3 80 – to the left of row 4 100 – to the left of row 5 |
| Horizontal Bar Graph Labels | ||
| Total Test (leftmost bar) | N/A/ | The text “Total Test” under the first bar If there are any footnotes for the Provincial Achievement Test place an asterisks ‘*’ after the “Total Test” label |
| Max Score | display this information underneath the ‘Total Test’ label | |
| Component Bars | Component Title | |
| Max Score | Display this information under the Component Title | |
| Vertical Bars | ||
| Total Test (leftmost bar) | This bar contains information on the PAT Result Score and is divided into 3 parts: * The bottom section of the bar graph will be light grey in color and will extend vertically up the bar graph until it reaches the numerical value on the graph representing the Acceptable Cut Score for the Provincial Achievement Test. * The middle section of the bar graph will be black in color and will continue to extend vertically up the bar graph until it reaches the numerical value on the graph representing the Excellence Cut Score for the Provincial Achievement Test * The top part of the bar graph will be dark grey in color and will continue from the Excellence Cut Score and extend vertically up the bar graph until it reaches the Max Score (top of the bar graph) * A small white circle will be placed (centered) in the bar at the numerical value of the Score for the PAT Result. |
|
| Component Results | If there are component results, there will be two bars to show those results.
The components will be displayed in alphabetical order based on their Provincial Achievement Test Component Code. |
|
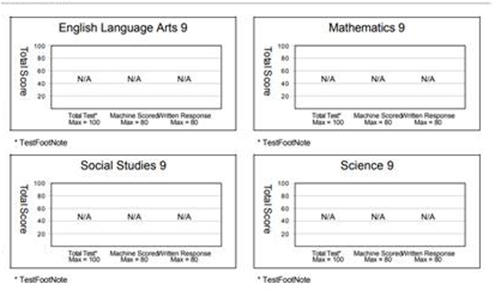
The following data is included in the first page “Graphs” section of the report when the PAT Result Status or PAT Component Result Status is not “Normal”:
| Result | What the Graph Should Show |
|---|---|
| Excused | Full Graph with N/A where each Bar Graph would be |
| Absent | Full Graph with N/A where each Bar Graph would be |
| Withheld | Full Graph with N/A where each Bar Graph would be |
| Incomplete | Full Graph with N/A where each Bar Graph would be |
| Invalid | Full Graph with N/A where each Bar Graph would be |
PAT ISP Page Two
Body
Data Elements
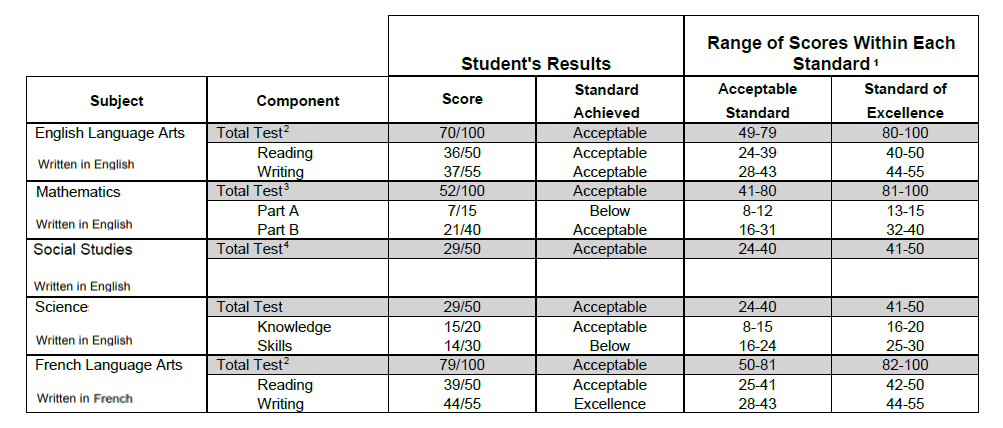
The following data is included in Document Body section of the report when the PAT Result Status or PAT Component Result Status is “Normal”:
| Element | Source Data Set Element | Source Attribute |
|---|---|---|
| Subject Column | ||
| Subject | N/A | “Subject” |
| Row Headers | PAT Course Name | Rows for each Pat Result that the student has written for that school year in the following order if applicable o English Language Arts o Mathematics o Social Studies o Science o French Language Arts |
| Blank Line | N/A | |
| Written In | Provincial Achievement Test Language | The text “Written In:” followed by the language from the PAT definition |
| Element | Source Data Set Element | Source Attribute |
|---|---|---|
| Component Column | ||
| Component | N/A | Column Header label is “Component” |
| For each row in the table, corresponding to the number of PAT results | ||
| Total Test | Footnote | Concatenate “Total Test” and Footnote with borders and cell light grey filled |
| Component | English Component Label | If Components exist for this PAT, there will be two |
| Student Results Column Grouping | A column header grouping that will group the following two columns in the table • Score • Standard Achieved |
|
| Score Column | ||
| Score | N/A | Column Label header is “Score” |
| For each row, for each Course on the PAT display on separate rows | ||
| {#PATResult} / {#PATMax} | Score / Max Score | For each Course on the PAT display – with borders and cell light grey filled |
| {#Score} / {#MaxScore} | Component Score / Component Max | For each Component for this PAT result If there are no Provincial Achievement Test Components for the Course then those spaces will appear blank. |
| Standard Achieved Column | ||
| Standard Achieved | N/A | Column Label Header is “Standard Achieved” |
| For each row, for each Course on the PAT display on separate rows, corresponding to the “Component” rows | ||
| {StandardAchievedPAT} | “Excellence”, “Acceptable”, or “Below Acceptable” – “Excellence” displayed if the score on the PAT Result is equal to or greater than the Excellence Cut Score on the PAT – “N/A” displayed if the Excellence Cut Score is NULL – “Acceptable” displayed if the score on the PAT Result is equal to or greater than the Acceptable Cut Score and less than the Excellence Cut Score on the PAT – “Below Acceptable” displayed if the score on the PAT Result is less than the Acceptable Cut Score on the PAT. – “N/A” displayed if the Acceptable Cut Score is NULL. |
|
| Range of Scores within Each Standard Column Grouping | A column header grouping that will group the following two columns in the table • Acceptable Standard – located after the ‘Standard Achieved’ column • Standard of Excellence – located after the ‘Acceptable Standard’ column |
|
| Acceptable Standard Column | ||
| Acceptable Standard | N/A | Column Header Label |
| For each row, for each Course on the PAT display on separate rows, corresponding to the “Component” rows | ||
| {#AcceptableMinPAT} - {#AcceptableMaxPAT} | Acceptable Cut Score - Excellence Cut Score - 1 display N/A if the cut score is NULL | with borders and cell light grey filled |
| For each English Component Label on the Provincial Achievement Test Component | ||
| {#AcceptableMinPATComponent} - {#AcceptableMaxPATComponent} | Component Acceptable Cut Score - Component Excellence Cut Score - 1 display N/A if the cut score is NULL | |
| Excellence Standard Column | ||
| Standard of Excellence | N/A | Column Header Label |
| For each row, for each Course on the PAT display on separate rows, corresponding to the “Component” rows | ||
| {#ExcellenceMinPAT} - {#ExcellenceMaxPAT} | Excellence Cut Score - Max Score display N/A if the cut score is NULL | with borders and cell light grey filled |
| For each English Component Label on the Provincial Achievement Test Component | ||
| {#ExcellenceMinPATComponent} - {#ExcellenceMaxPATComponent} | Component Excellence Cut Score - Component Max Score display N/A if the cut score is NULL | |
The following data is included in Document Body section of the report when the PAT Result Status or PAT Component Result Status is not “Normal”:
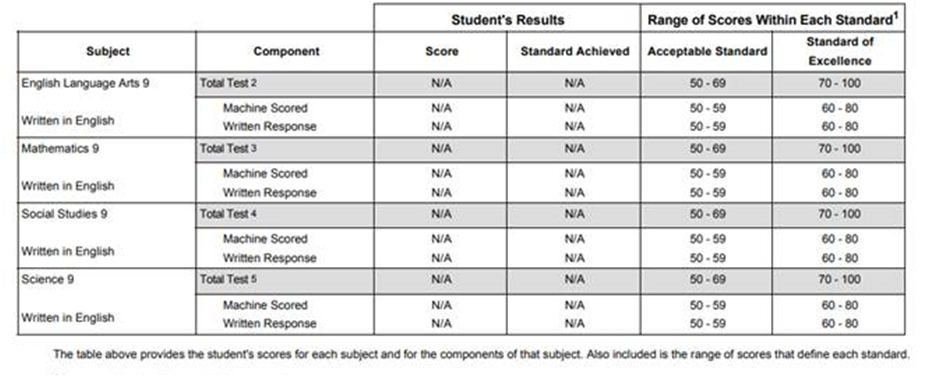
| Result | What the Table Should Show | |
|---|---|---|
| Score | Standard Achieved | |
| Excused | N/A | N/A |
| Absent | N/A | N/A |
| Withheld | N/A | N/A |
| Incomplete | N/A | N/A |
| Invalid | N/A | N/A |
Footnotes
Data Elements
| Element | Source Data Set Element | Source Attribute |
|---|---|---|
| First Sentence | N/A | Text that reads: “The table above provides the student’s scores for each subject and for the components of that subject. Also included is the range of scores that define each standard.” o Left Justified o displayed above the footnotes |
| Footnote 1 | N/A | Text that reads: “1These standards reflect provincial expectations.” o this will always be the first footnote displayed. |
| Other Footnotes | Footnote | o Formatted exactly as stored in the Footnote o 1 Footnote per row |
Page Footer
The information on this page is managed by PASIprep PASI Settings and PASI Settings - Edit PAT Result ISP Footer - English Text


